A critical view on climate impact in the coffee industry
Barista Hustle has commenced work on a free course that helps baristas and cafe owners make informed decisions about how to operate in a world beset by climate change. We acknowledge that our industry has a history of colonialism, exploitation, and green washing. The intention of this course is to put readers in the driver’s seat. With the help of wonderful people like Professor Stephen Abbott (who has produced an app for this course that gives everyone access to the technology you need to run your own life cycle analysis) this course will inspire you to reduce your emissions. From the first lesson, you will discover how baristas can make a gigatonne-difference to cutting carbon. This course will be published in episodes here on our blog and will go out to our BH Unlimited subscribers with their unlimited updates.
What’s in a Carbon Footprint?
Before we can analyse all of our inputs, we need to understand what it is that we’re analysing. In our ‘Goal Definition and Scope’ in the previous lesson, we explained that for the Coffee Footprint Analyser, we’ve chosen to limit ourselves to analysing the carbon footprint, which is measured in kilograms of CO2 per kilogram of coffee.
However, not every kilogram of CO2 we include will be a literal kilogram of gas released to the atmosphere. Some of the carbon footprint comes from other greenhouse gases, and some is produced (or offset) indirectly, as a result of other activities related to coffee production. All of these sources need to be included in our analysis.
Greenhouse Gases
Greenhouse gases (GHGs) are measured in terms of carbon dioxide equivalents (CO2-eq). A 1-kg equivalent represents any emission with a global warming potential (GWP) over a 100-year period that equals the effect of releasing 1 kg of CO2 to the atmosphere.
Carbon dioxide, which is used as the basis of measurements, is the most important anthropogenic GHG simply because of the sheer amount that has been released as a result of human activities. However, a number of different gases contribute to the greenhouse effect, many of which have a much higher global warming potential than CO2.
The most important GHG is actually water vapour, which accounts for about 60% of the warming effect of the Earth’s atmosphere, due to the sheer amount present in the atmosphere. The global warming potential of water vapour per kilogram is hard to quantify, but its impact is considered very low relative to that of CO2: one estimate puts it between 0.001 and 0.0005 times that of CO2 (SC Sherwood et al., 2018).
The amount of water vapour in the atmosphere isn’t directly affected by human activity, but rather depends on the global temperature. As the temperature rises, the atmosphere can hold more water vapour. Because of this effect, water vapour is thought to amplify the effect of other GHGs: releasing CO2 increases the global temperature, which in turn increases the amount of water vapour in the atmosphere and further increases the greenhouse effect. This feedback process is thought to double the global warming potential of other GHGs (IPCC, 2007).
Carbon dioxide is the second most abundant GHG, and its concentration has greatly increased in the atmosphere as a result of human activity. It is primarily released by burning fossil fuels, but as much as a third is released as a result of land use changes, mainly as a result of burning associated with deforestation (IPCC, 2007).
Methane (CH4) and nitrous oxide (N2O) are the most important anthropogenic GHGs after CO2. These gases are released to the atmosphere as part of natural processes, but their concentration has greatly increased as a result of human activity, primarily due to agriculture. These gases also have indirect effects on global warming, by inducing changes in the way CO2 is taken up by the oceans and biosphere (T Gasser et al., 2017). Methane also interacts with other GHGs in the atmosphere or breaks down to form other GHGs, thereby greatly increasing its global warming potential (DT Shindell et al., 2005). The full extent of these indirect effects is not fully determined. Including indirect effects, the global warming potential of methane and nitrous oxide over a 100-year period has been estimated at 34 and 298 times that of CO2, respectively (IPCC, 2013).
Another important GHG, ozone (O3), is not released directly but is formed by the action of sunlight on pollutants and by the chemical reactions involving methane in the atmosphere. Ozone has a high global warming potential but is short lived in the atmosphere. Because it is produced indirectly and the atmospheric concentrations are highly variable, the exact effects of ozone are hard to quantify.
Other important GHGs include synthetic GHGs such as chlorofluorocarbons (CFCs) and hydrofluorocarbons (HFCs). Synthetic CFCs have been released in relatively small amounts, but they play an important role because they have global warming potentials thousands of times that of carbon dioxide (IPCC, 2013).
Because of their high global warming potential compared with CO2, reducing non-CO2 GHGs is essential to any effective climate change policy (DS Reay et al., 2012).
Land Use Changes
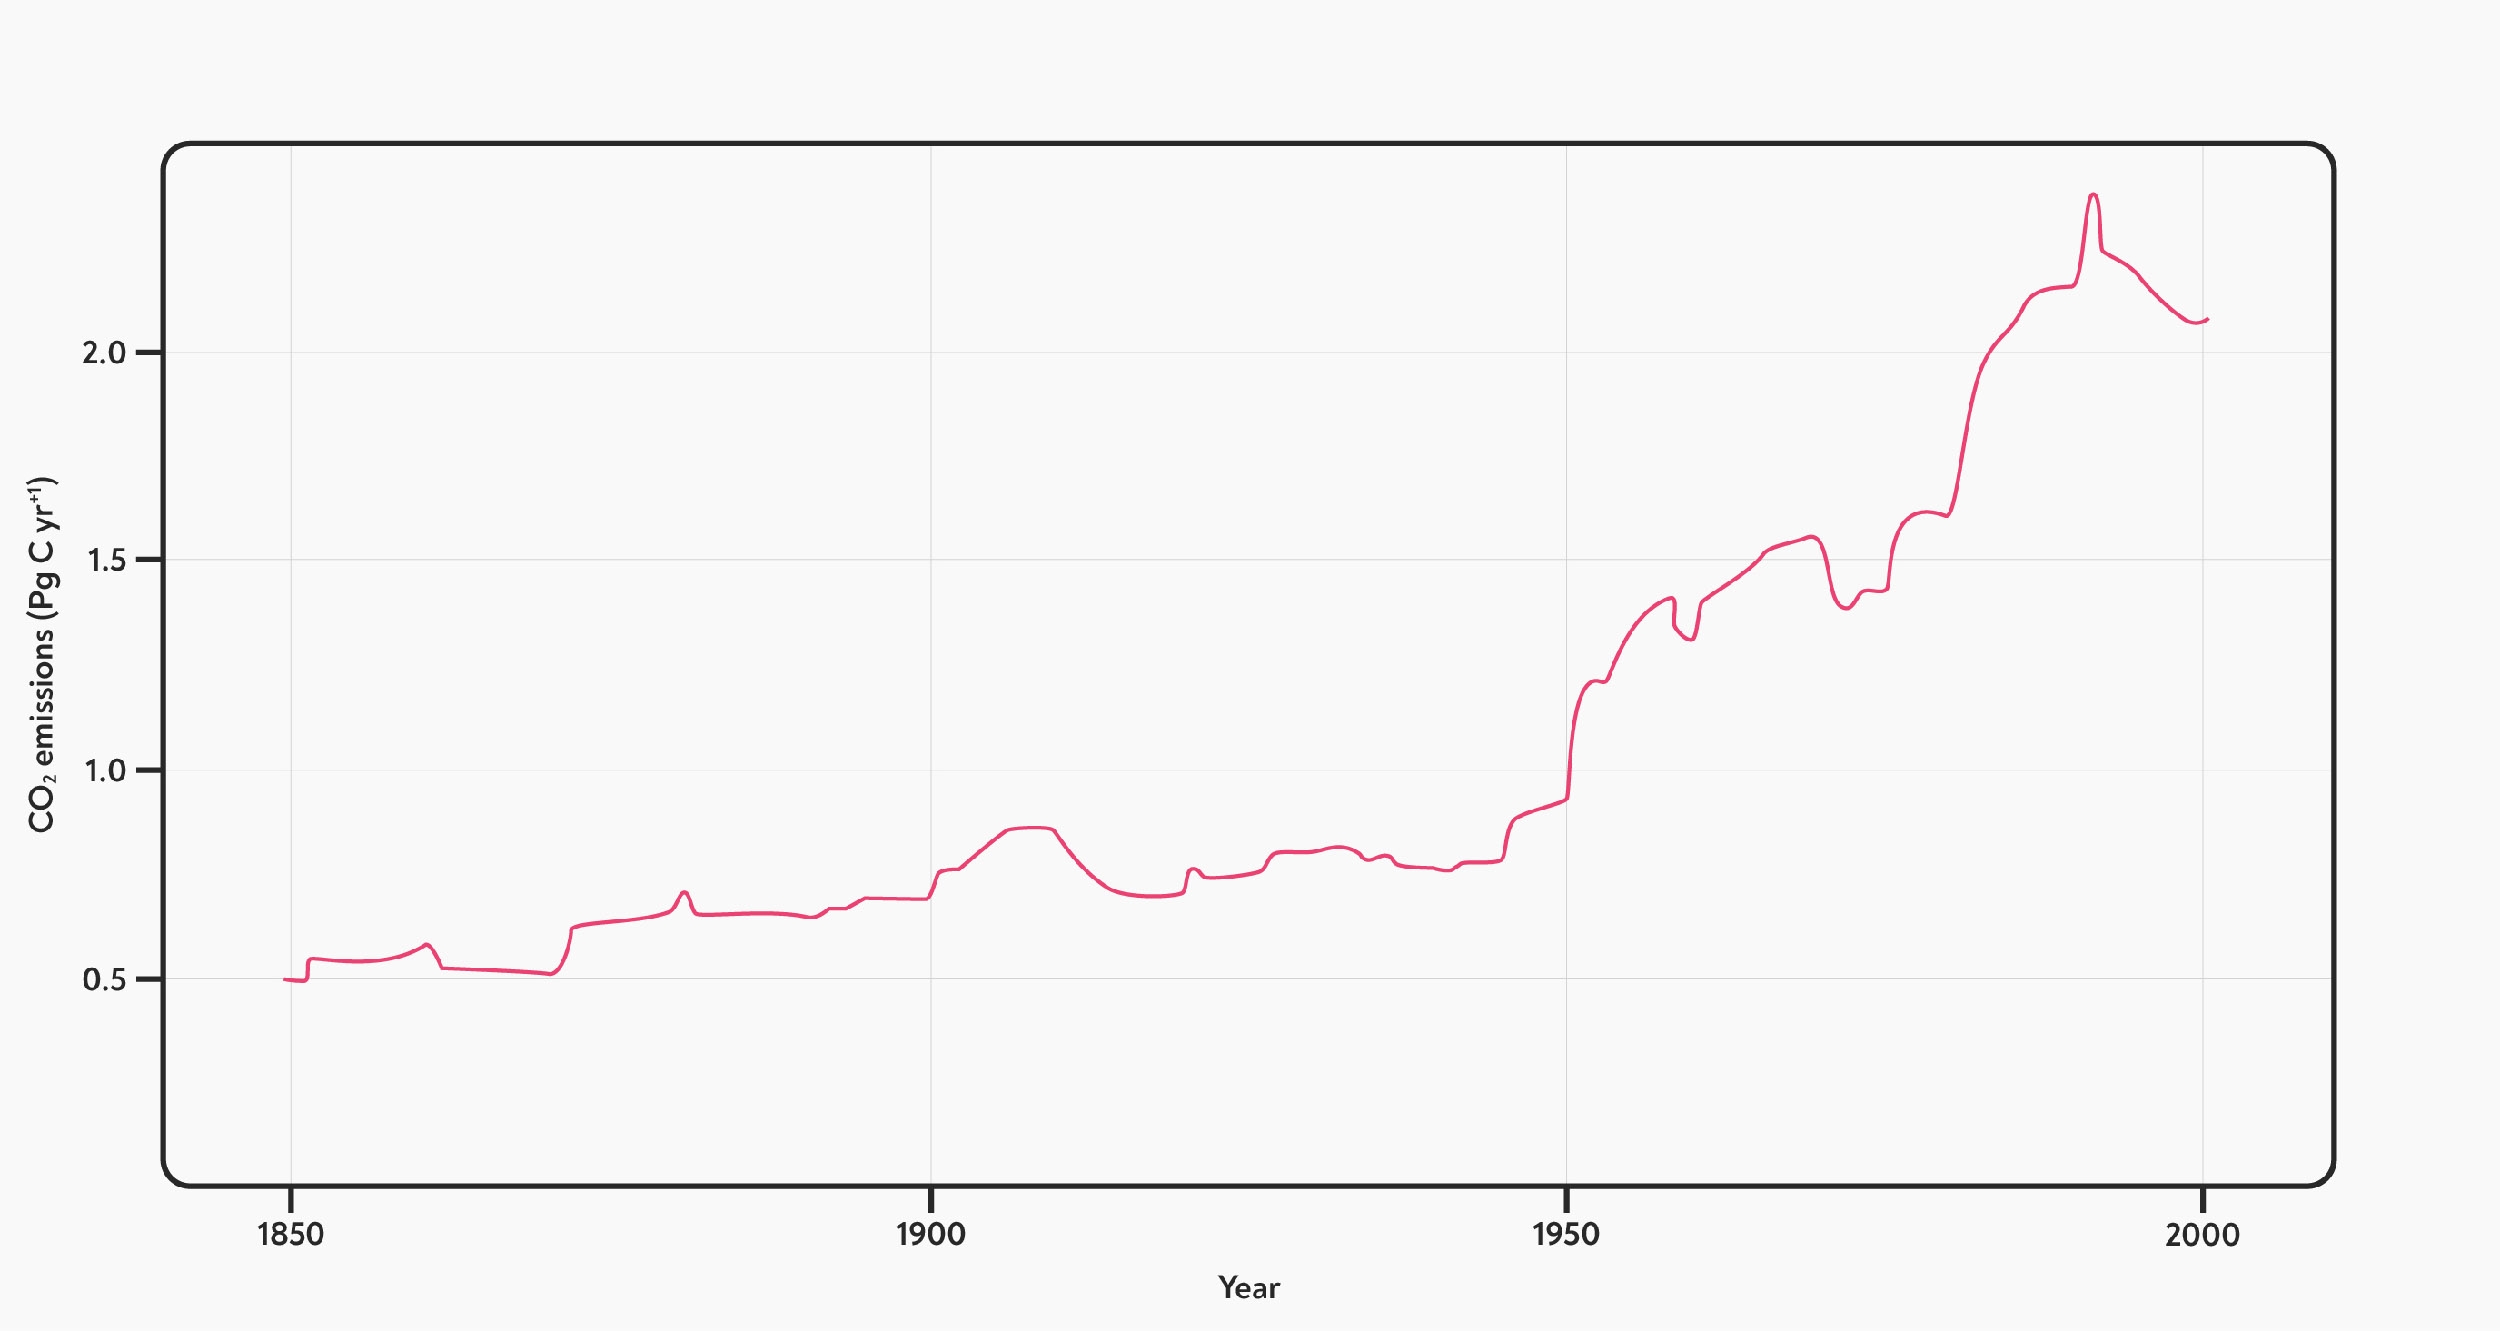
An analysis of coffee’s carbon footprint also needs to include analysis of land use changes. The land can both release and absorb GHGs, and emissions from land use changes have increased greatly over the last century, mainly due to tropical deforestation (K Banskota et al., 2007). Carbon is stored in vegetation and in the soil, and clearing land for agriculture can release significant amounts of CO2, both from the burning or decaying of removed biomass and from soil disturbances (B Quesada et al., 2018).
 CO2 emissions from land use changes, 1850–2000. Taken from K Banskota et al. (2007).
Forests are particularly important in this respect: deforestation contributes more carbon emissions globally than transportation does, and more carbon is contained in the world’s forests than in the atmosphere (CAG Hunt, 2011).
The amount of forest cover also affects global warming in other ways not included in a carbon footprint analysis, for example, by changing the Earth’s albedo (how much it reflects sunlight) and because the evaporation of water from leaves has a cooling effect (IPCC, 2019). Because of the particular importance of deforestation and forest management in coffee, we’ll directly include land use changes in our analysis.
Carbon Sequestration and Offsets
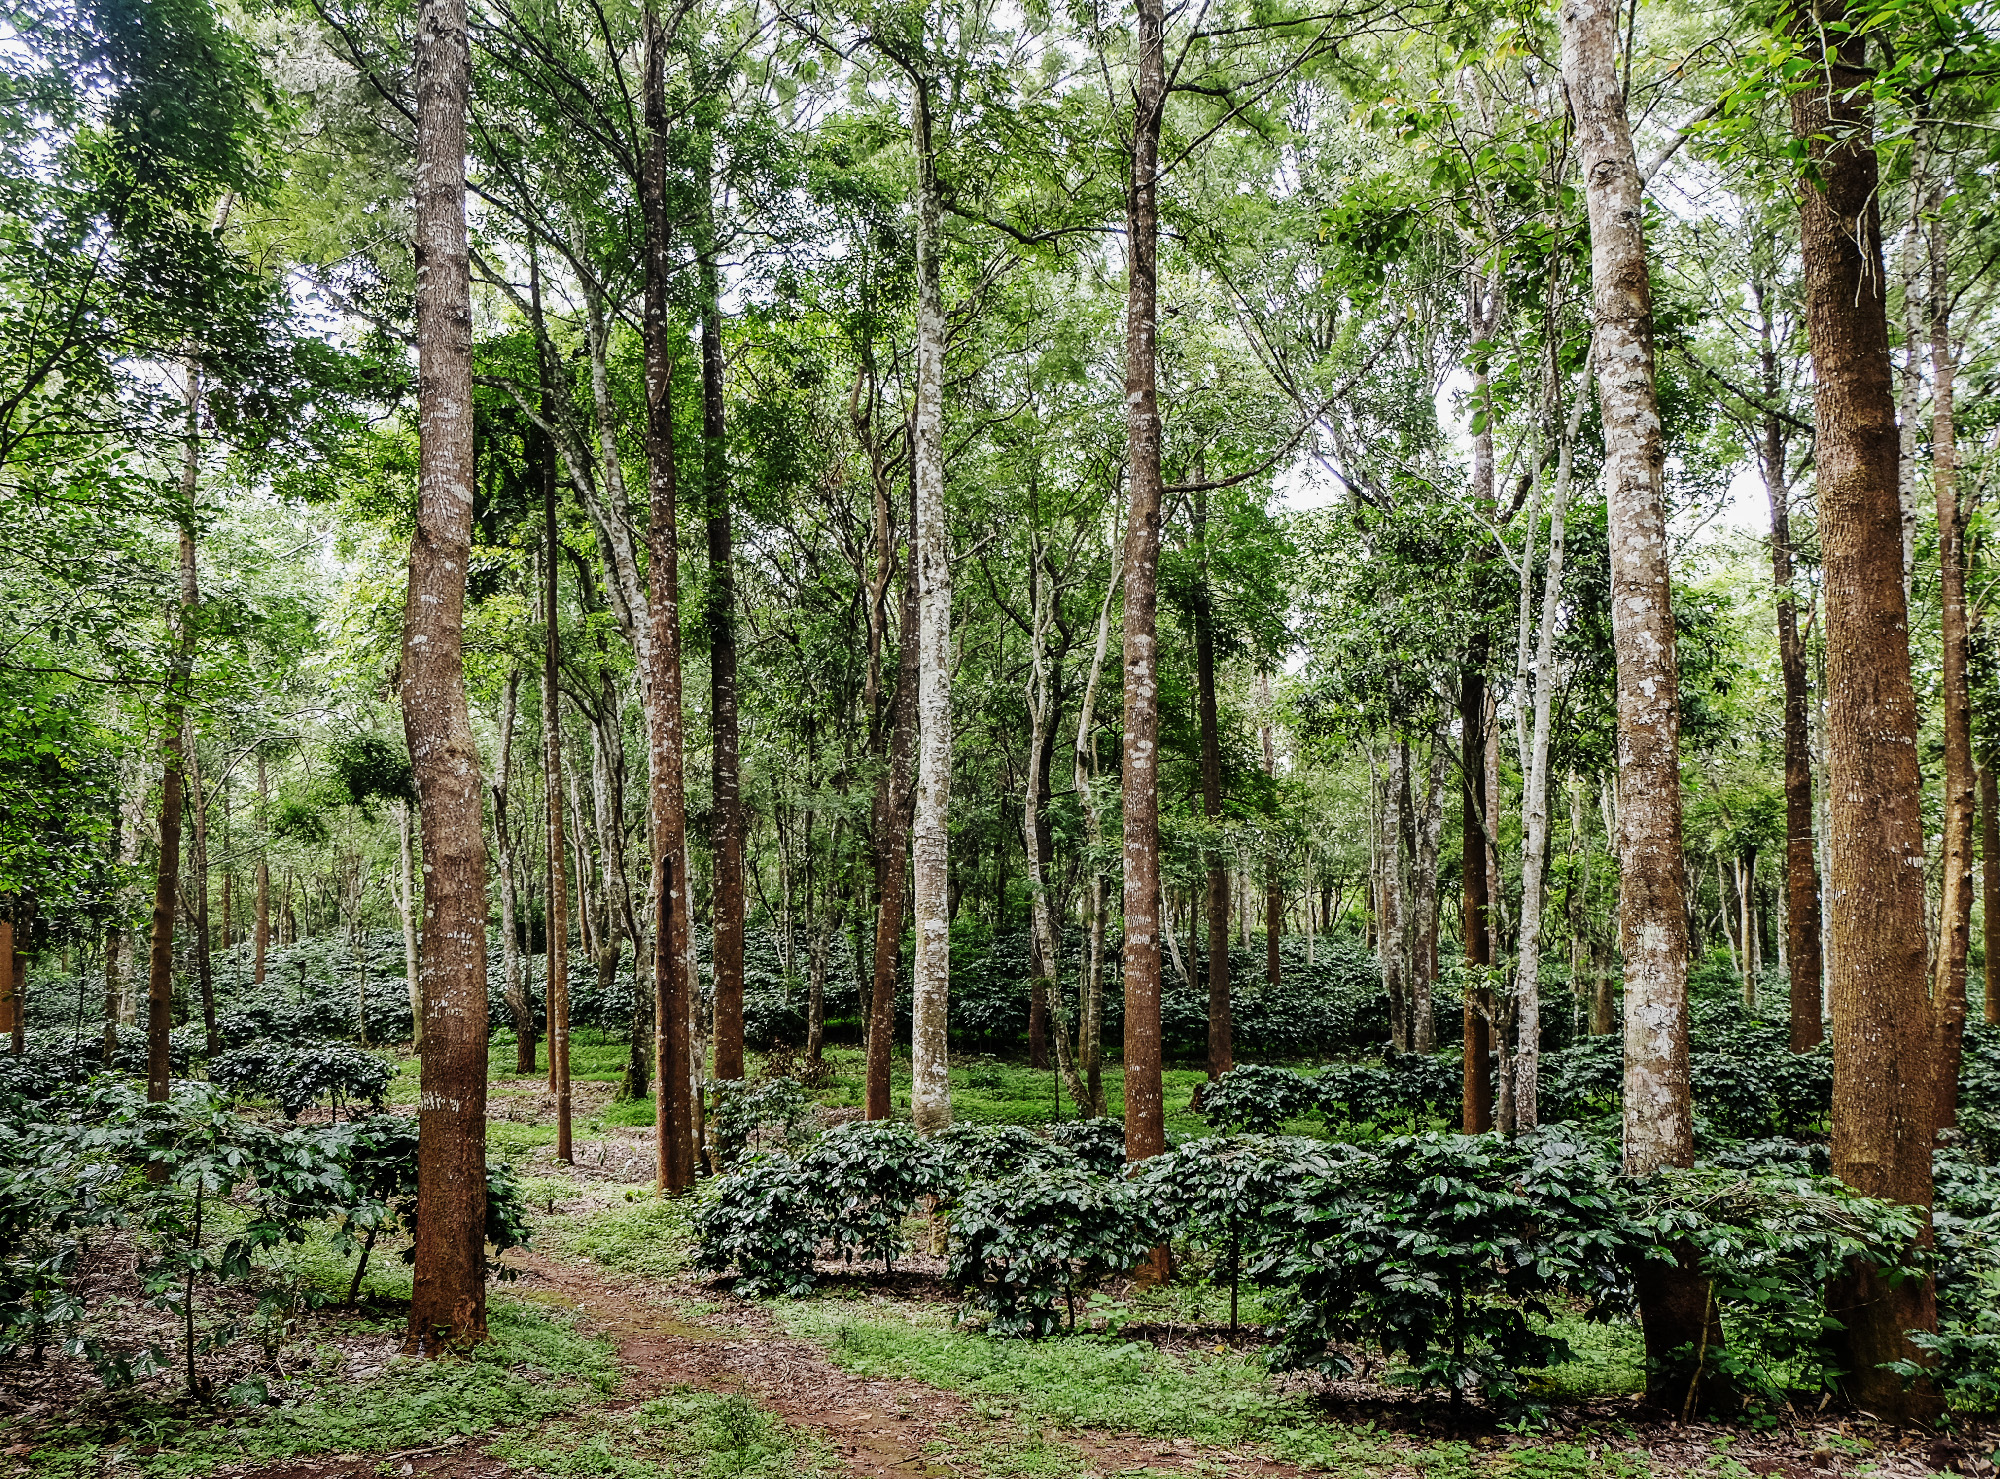
Coffee is often grown alongside other tree crops or among shade trees. These trees have some potential to act as a store of carbon or to increase the storage of carbon in the soil. This uptake and storage of carbon is referred to as ‘sequestration’. A shade-grown coffee farm with large forest trees can sequester 70–80 tonnes of carbon per hectare, which is more or less equivalent to the carbon stored in an equal area of forest (NPA Kumar et al., 2019).
Trees can also be deliberately planted to ‘offset’ the carbon footprint of other activities, but since this is not directly part of coffee production, we will not consider this as part of our analysis.
