The act of grinding coffee is full of mystery and myth. A group of likeminded people recently embarked on a project to shed some light on coffee grinding, and found some interesting results. So interesting, that we decided to turn it all into a paper; subjecting our methods to peer review and the rigorous process of publication. Last week, this paper was published in a Nature sub-journal -Scientific Reports- as open access. This means anyone can read and benefit from the results. Yay for science!
Scientific papers like this must be written in a certain way that can be hard to digest. I’d like to spend some time tearing apart the paper; describing what we did, and what I think it means. Feel free to follow along with the actual paper here.
I’m going to include my personal and sometimes debatable opinions/remarks in bold like this so you don’t fall asleep.
The Effect of Bean Origin and Temperature On Grinding Roasted Coffee
Introduction
This is a super basic rundown of what’s up with coffee and this experiment. Not everyone peer reviewing this knows as much about coffee as most of you do, so we thought it relevant to include some pertinent details:
- There are two main considerations with green coffee; variety and processing.
- Roasting plays a large role in how coffee tastes.
- Most compounds in roasted coffee are products of Maillard reactions, but there’s a lot going on.
- We used four different coffees for the experiment:

And finally, that this experiment is primarily interested in how bean origin, processing method, roast level and temperature can affect the results of grinding.
Method
Coffee is extremely complex. It’s nearly impossible to create a computer model of how it fractures during grinding, so we have to do it experimentally.
We did two main things for the experiment:
- We ground coffee of different origins/roasts/processes at the same setting and measured the resulting grind samples.
- We changed the temperature of one coffee to four distinct levels, ground a sample while it was still at each temperature, and measured the resulting grind samples.
To measure the grinds we used…
Laser Diffraction Particle Size Analysis
We assumed that the most important metric for measuring ground coffee is the particle distribution. That is, a measurement of the size (diameter) of every single coffee grind in a sample. Yes, flavour is important, but it’s much much more difficult to measure flavour with any accuracy and precision.
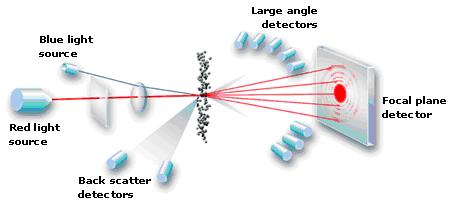
Measuring particle distribution of coffee is performed with a laser diffraction particle analyser (LSA). Essentially, it sucks coffee grinds down a tube, shines a light across their path and measures the “shadows” that each individual grind casts onto a detector. It’s actually much much more complex than that, but this description will suffice. My brain hurt trying to delve further. They’re incredibly precise, sensitive machines and need to be calibrated often. Here’s a simple diagram showing the usual setup inside an LSA.
 Particle Analytical ApS
Grinding
We used an EK43 for the study, because it holds a negligible amount of grinds in the chute after the burrs. This study relied on coffee beans being ground at specific temperatures, and not suffering from any cross-contamination. We couldn’t allow the beans to lose any energy to a hopper, grinder throat, or burrs for any appreciable amount of time before they were ground.
There were 3 EK43’s present during the experiment. One was found to be producing the most delicious coffee, and was used for the samples. It had Turkish burrs installed. EK43’s have quite a large potential for burr misalignment, so this grinder was likely the least misaligned.
We kept the grind setting precisely the same for every sample. 2.7 on the dial if you must know. We also let the grinder cool down to room temperature between every sample to rule out frictional/electrical heat as a variable.
Temperature-specific samples were kept in paper cups within different environments. Room temperature (20C), freezer (-19C), dry ice (-79C), and liquid nitrogen (-196C). They were ground within one second of retrieval and showed no water condensation.
We took 3 samples for each data set, and performed each of those twice. So, 6 data sets per temperature/coffee. The results of these data sets were also passed through an analysis of variance (ANOVA) to make sure they were similar enough to be considered accurate.
Do Differences in the Green Bean Affect the Final Grind?
Here’s where things get tricky to understand. You might be familiar with this kind of graph to communicate particle size distributions:
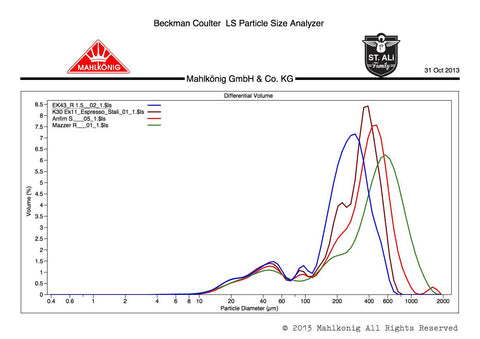
Along the x-axis (horizontal) is the size of the grinds in microns. 1 micron equals 1/1000th of a millimeter. This axis is on a logarithmic scale, which places 1 & 10 as far apart as 100 & 1000. This is because a sample of coffee grinds covers a huge 3 orders of magnitude (0 to ~1000 microns) and we need to fit it all in without losing too much resolution at the smaller sizes.
The y-axis (vertical) is the volume% of the grinds. This one’s easy: the higher the peak, the more of that size particle there are.
Eg. trace vertically above 400um to the brown line. That particle size makes up 8.5% of the sample by volume (not weight!).
We took this style of data presentation a few steps further for this particular experiment.

Firstly, let’s look at a count of the particles. Instead of showing volume, we simply graph how many of each size particle there are (blue). The first thing that’s rather obvious; there’s an INCREDIBLE number of tiny grinds in each sample. 99% of the particles are below 70 microns (0.07mm) in diameter. This means that for every single grind with a diameter above 100 microns, there’s one hundred million with a diameter below 100 microns. That’s an excellent piece of trivia with which to sound smart at dinner parties.
When analysing coffee grinds, a very important factor is their surface area. The more surface area they have, the faster and more easily water can extract its flavours. To turn the data above into something resembling surface area, we firstly assume that every particle is a sphere (this is fairly common practice, and for gnarly, uneven coffee it’s a “conservative estimate”). Then, we take the size of every particle and calculate what the surface area would be if it were a sphere.
This gives us some really cool data!
The solid lines below are the ‘counts’. The same as the blue line above
The dotted lines below are the ‘relative surface area contribution’. That is to say, the proportion of the total surface area that is provided by each particle size. Once again, something is quite obvious. The smaller grinds contribute the overwhelming majority of the total surface area. ~70% to put a number on it.

This graph also shows the particle distributions of the various coffees used in the experiment. Straight away, you will notice that they’re all incredibly similar. The Tanzanian, Ethiopian, El Salvadorian and Guatemalan profiles are shown in black, purple, red and blue, respectively.
Turns out that origin/processing/roast has much less of an effect on PSD than I had ever previously thought. This is arguably a good thing: we have less variables to worry about!

The next thing to wrap your thoughts around is that fines contribute 70% of the total surface area. Yes, water moves inside the grinds to extract solubles, but it takes exponentially longer for the water to get inside, do the work, and move back out into the brew. Fines are our friends!
Do Differences in the Roasted Bean Grind Temperature Affect the Final Grind?
This is where things get really interesting.
Coffee is amorphous – it’s made up of thousands of different molecules jammed together within an irregular plant structure.
The diamond in an engagement ring is crystalline – it’s a perfectly repetitious pattern of carbon atoms.
When you change the temperature of amorphous things, they sometimes undergo a ‘glass transition’. That is, they change from a soft and rubbery material to a hard and glassy one very quickly. Some materials also undergo a shattering transition, where they tend to break into more and smaller particles. This is all pretty key when discussing how coffee breaks apart in a grinder.

We found a very pronounced difference in the particle size distribution of one coffee ground at different temperatures. Firstly, make yourself familiar with each colour and the temperature it represents. You’ll notice that the mode (peak) of the PSD gets smaller as the temperature dips (31% drop over the 4 samples). As the coffee gets cooler it also becomes more brittle, throwing off many more tiny particles in the grinder. It also fails to escape the burrs at the larger sizes of the warmer samples (ie. shatters more easily).
The largest difference is between 20C and -19C. The coffee likely undergoes some kind of shattering/glass transition between these two.
We also confirmed that this transition is reversible, so you don’t need to worry about a coffee getting too hot and not being able to go back to tasty town.

The mode is the most-occurring particle, easily identified as the highest “peak” of each line. This gets larger as the temperature increases.
Skewness is merely a numerical representation of asymmetry in a data set. The colder samples were less skewed because they contained more small particles and fewer large ones, reducing area under the line to the right of the peak.
Mean is the average. You’ll see the freezer has a higher mean than the room temperature sample. This is because the room temperature sample had many more particles in the 3-5um range, but far fewer in the 8-30um range.
This transition temperature will likely be a very important discovery for all future grinding technology.
Concluding Remarks and Thoughts
Origin and Processing
Anyone who blends coffee will be happy to note that the surface area of different coffees is pretty much the same at a fixed grind size. This means that the major consideration for blending is to ensure that each blend component is equally soluble. In other words, that they all reach the same level of extraction within the same brewing time. Roasters, dust off your refractometers.
Temperature
Remember all those mornings when you dialled in a coffee perfectly, only to have it thrown out the window after you made ~20 coffees? The culprit isn’t the grinder expanding from the heat; it’s the beans soaking up the heat from inside the grinder before they’re ground. That heat energy makes them less brittle, creating a coarser grind even though you didn’t change the grind setting.
Here’s some more questions with pretty much the same culprit. Ever wonder why…
- coffee doesn’t taste as good on a hot day?
- your grinder can seem so inconsistent in quiet periods?
- the shots run faster during a rush?
- this all doesn’t happen with an EK43?
- After grinding finer to achieve the same shot time, that the shots don’t taste the same as they did in the early morning?
The culprit for all of these is: the beans heating up inside the grinder and grinding differently.
The less time the beans spend in the grinder, the less they’ll be affected by its heat. It’s extremely difficult and costly to create a grinder throat that evenly heats or cools the beans before grinding. With that, I strongly believe that the only way forward is to use grinders that don’t contain any coffee between doses.
I’ve never really been a fan of the results with the Mythos grinder’s heating feature, and this experiment is an excellent explanation as to why. Heating the beans to achieve consistency pushes the beans above the shatter transition temperature and significantly reduces the total surface area (read: less and less-even extraction).
More cold = finer particles = more surface area = higher extraction. Lower temperatures could also mean less evaporation/sublimation of aromatic compounds (aroma loss).
Keep your pre-weighed doses in the freezer for higher, tastier extractions (though make sure they’re sealed without too much moisture or any oxygen).
Fines
Wow. Back in 2012 I won the World Brewers Cup with a routine centred around removing fines. As it turns out, sifting doesn’t really get rid of all the small particles. There’s still millions of them stuck to the larger grinds. When coffee is torn apart in the grinder it leaves pockets of positive and negative charges all over the grinds that attract the fines. Conclusion: sifting is pretty useless for particle segregation and testing.
Now that we know just how much of the brew is made up of fines extractions, it becomes increasingly obvious that fines aren’t the villain; otherwise every coffee ever made would be horribly over-extracted. Here’s how to think about it: The upper limit of tasty extraction is decided by the most-extracted particle. This is always the smallest particle. So it’s up to you to make sure no portion of the grinds ever get over-extracted.
It’s also up to you to reduce the amount of coffee that’s under-extracted (ie. the inside layers of the largest grounds). The simplest way to do this is -as I’ve always said- to use a grinder that produces an even particle distribution. Nothing new here.
Once I figure out how to brew fines properly I’ll be back at the WBrC with an apology routine!
A good days work. Looking forward to the comments, suggestions and corrections!
If you have found this useful and want to enjoy delicious coffee with the rest of the community – register for our unlimited education subscription. Or if you just want to keep up with every thing Barista Hustle – sign up to the Newsletter.
Thanks to the team:
Christopher Hendon (Author of Water for Coffee and Post-Doctorate at MIT) came up with the whole thing and managed every aspect. He’s a human embodiment of science itself.
Maxwell and Lesley Colonna-Dashwood (Colonna Coffee, Bath) played integral roles designing, facilitating, and performing the experiments.
Erol Uman and Brian Miller (Meritics Ltd.) graciously supplied the laser particle analyser.
Stephen Leighton (HasBean Coffee) supplied delicious roasted coffee.
Christian Klatt (Mahlkonig) contributed grinders and experimental design.
Keith T. Butler (Department of Chemistry, University of Bath), Brent C. Melot (Department of Chemistry, University of Southern California), and Rory W. Speirs (School of Physics, The University of Melbourne) provided invaluable advice towards experimental design and execution.
Matt Perger contributed to the experimental design and wrote this explainer.


Hi Matt and BHTeam,
came here from the link in the ACM course and first of all, perks on the courses, has really help me to understand coffee making and brewing so much better. After reading the article one question comes to my head, does coffee varietals/origin density have an effect on the extraction level? From what I understood here is that as long as you can evenly grind a coffee bean it should not matter, if its a denser structure, the bean will still break down into much smaller pieces that can be neatly extracted.
I once heard from one of my colleagues that we should grind finer and add more coffee to our dose when using certain high altitude beans otherwise we will not get a good tasting extraction.
Any thoughts?
Thank you,
Darío.
Hi Dario,
Definitely when a coffee is more micro porous, extractions yields increase. This is why more developed roasts tend to be easier to extract. So it’s not always the case that a coffee grown at higher elevations will be less porous — if it’s roasted really well it could be easier to work with than a very underdeveloped low grown coffee. But one thing is for sure though: It’s harder to get good extraction yields if you up-dose. So we don’t endorse the practice of adding more grinds to the basket when you’re looking to increase extraction yields. It’s much easier to use more water instead. BH
Pictures is not available?
Hey Matt,
I just came across this interesting reading but I cannot find a answer to questions asked regarding the difference between producing fewer fines and grinding finer. Also I would be interested in continuing this experiment to the other extreme ala James Hoffman’s heating the beans to 60C to grind.
Hey Barry, You might find out white paper called the Grinder Heating experiment interesting reading. We follow up on Hoffmann’s 60°C idea there.